

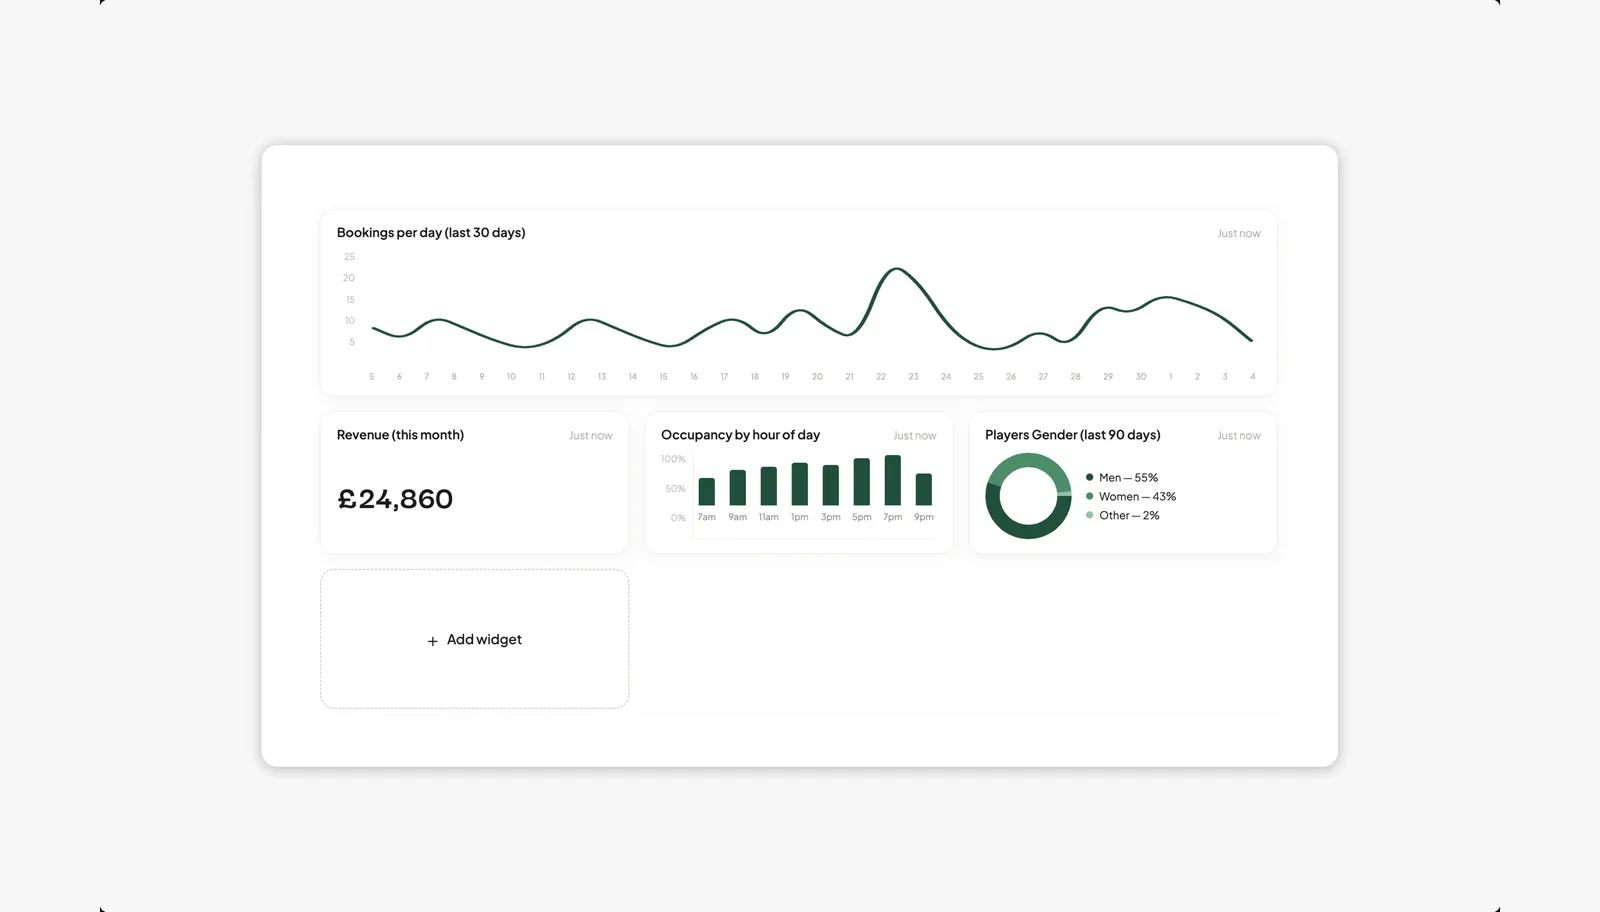
We’ve introduced Custom Graphs to Nettla AI, giving club admins the ability to build their own graphs simply by describing what they want to see. Instead of a fixed set of dashboard widgets, you can now ask for exactly the data that matters to your club and have Nettla AI create it for you.
How it works
- Ask Nettla AI for a graph in plain language, for example “Show me bookings per court over the last 14 days” or “Compare padel and tennis revenue this month”
- Nettla AI builds the graph for you and adds it straight to your insights page
- Graphs update in real time, so a “last 14 days” graph always reflects the most current data automatically
- Choose the format and positioning of each graph — move it around, make it wider, or rearrange your whole layout to suit how you like to work
- Build up a full page of graphs over time, each one created for exactly the insight you asked for
Why this feature matters
Every club cares about different numbers. One might live and die by court utilisation during peak hours, another by membership growth, another by how revenue splits across sports. A single fixed dashboard can never cover every club’s priorities. Custom Graphs lets each club build their own bespoke insights page, shaped entirely around what matters to them — no waiting on a product roadmap, no digging through reports that aren’t quite right. Just ask, and the insight you need is there.